Note
Go to the end to download the full example code.
FEM result interpolation#
This example shows how to run a simple FEM model with FElupe. A record-function collects the point- and cell-data dicts at the snapshots.
import felupe as fem

mesh = fem.Rectangle(n=6)
region = fem.RegionQuad(mesh)
field = fem.FieldContainer([fem.FieldPlaneStrain(region, dim=2)])

boundaries = fem.dof.uniaxial(field, clamped=True, return_loadcase=False)
solid = fem.SolidBody(umat=fem.NeoHooke(mu=1, bulk=2), field=field)

if int(fem.__version__.split(".")[0]) < 10:
    boundaries, loadcase = boundaries

snapshots = fem.math.linsteps([0, 1], num=3)
ramp = {boundaries["move"]: snapshots}
step = fem.Step(items=[solid], ramp=ramp, boundaries=boundaries)

point_data = []
cell_data = []


def record(*args, **kwargs):
    point_data.append(dict(u=field[0].values))
    cell_data.append(dict(E=field.evaluate.log_strain()))


job = fem.Job(steps=[step], callback=record)
job.evaluate()
Then, use the lists of point- and cell-data at the snapshots to create a
SnapshotModel.
import statescale

model = statescale.SnapshotModel(
    snapshots=snapshots,
    point_data=point_data,
    cell_data=cell_data,
    kernel="surrogate",  # use a surrogate model for interpolation
    modes=(2, 10),  # choose min-max mode-range for surrogate model
    threshold=0.999,  # ratio of included singular values for surrogate model
)
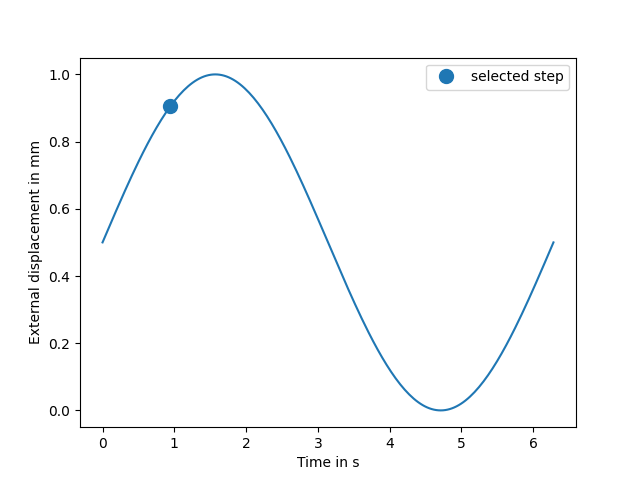
A signal will be used to interpolate (evaluate) the point and cell data.
import numpy as np
import matplotlib.pyplot as plt

time = fem.math.linsteps([0, 1], num=200) * 2 * np.pi
signal = 0.5 + np.sin(time) / 2

plt.plot(time, signal)
plt.plot(time[30], signal[30], "C0o", ms=10, label="selected step")
plt.xlabel("Time in s")
plt.ylabel("External displacement in mm")
plt.legend()
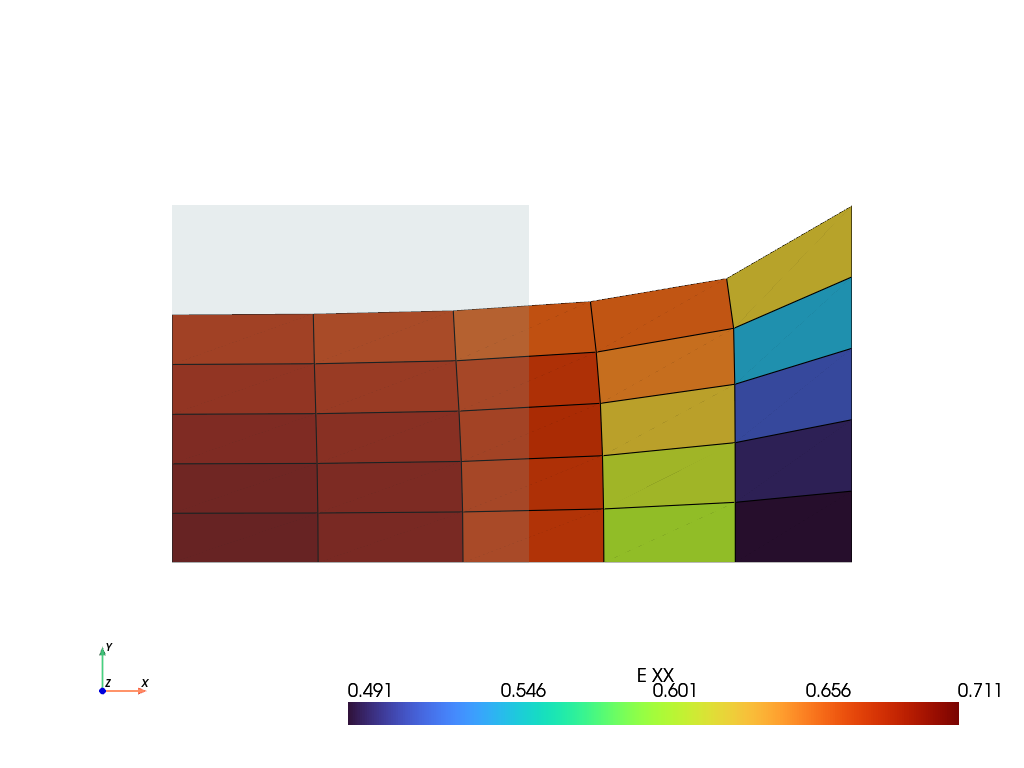
The results are used to plot the deformed FEM model along with a chosen cell-data at
step 30. Basic math, like transpose, can be applied to the model result. Any custom
math-function can also be applied on the arrays of the dicts by
apply(). The model result can be converted to a list and
supports iteration.
import numpy as np

out = model.evaluate(signal)
data = out[30]

data = data.apply(np.mean, on_cell_data=True)(axis=-2)
data = data.apply(np.transpose, on_cell_data=True)()

view = data.as_view(field=field, inplace=True, update="u")
view.mesh  # PyVista UnstructuredGrid

view.plot("E").show()
Total running time of the script: (0 minutes 7.337 seconds)